From copy-paste purgatory to one-click tables: automating Bloomberg screenshot data entry
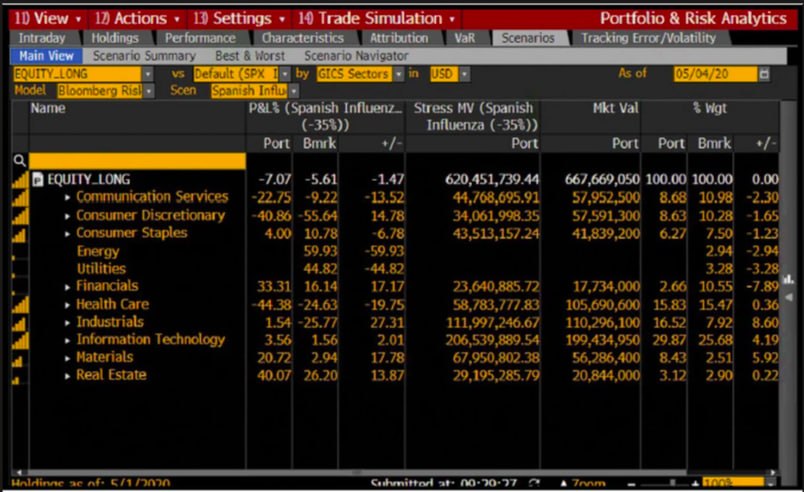
If you’ve ever worked with Bloomberg terminal data, you know the drill. A screenshot lands in your inbox — a PRA (Portfolio Risk Analytics) table, a pricing grid, a yield curve — and now someone has to get those numbers into Excel.
The “old way” looked like this:
- Select-all on the screenshot data, or manually retype what can’t be selected.
- Paste into Excel, and watch it land as one garbled column, or as text mashed into the wrong cells.
- Manually split columns, fix misaligned rows, strip stray characters, re-align headers.
- Repeat for every single report, every single day.
None of this is hard, exactly — it’s just slow, repetitive, and error-prone. A five-minute task done fifty times a week isn’t a five-minute task anymore; it’s hours of manual data wrangling that produce zero new insight, just friction between “the data exists” and “the data is usable.”
Source
What changed: an AI-assisted internal tool
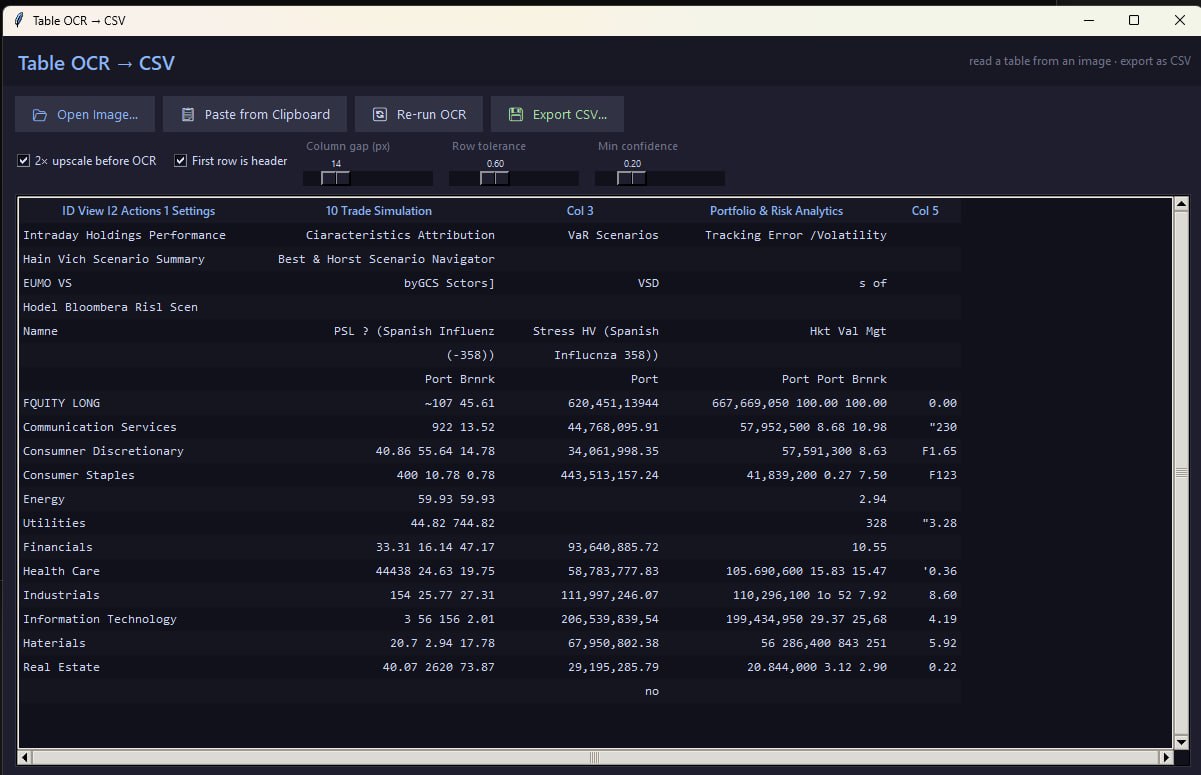
Working with Claude, we built a small internal tool that closes that gap directly: employees upload (or paste) a screenshot, and get back a clean, structured table ready to export as CSV — no manual column-splitting, no retyping, no Excel gymnastics.
The workflow now is:
- Paste a screenshot (or open a file).
- The tool runs OCR and automatically reconstructs rows and columns.
- Review the result in a live preview, nudge a couple of sliders if a table is unusually dense or oddly spaced.
- Export straight to CSV, already shaped correctly for Excel.
What used to be a multi-step manual cleanup process is now a paste and a click.
Solution
Tech stack, and why we chose it
- Python + Tkinter — a single-file desktop GUI. No install of a browser app, no server, no IT ticket to whitelist a web tool. Just a script (or a double-clickable
.batlauncher) that runs locally on the employee’s machine. - EasyOCR — handles the actual text recognition. We chose it over a cloud OCR API for two reasons: financial screenshots (portfolio positions, pricing data) shouldn’t need to leave the building to get parsed, and EasyOCR’s recognition model runs fully offline after the first download — so once it’s set up, the tool works with no ongoing dependency on external services, uptime, or API cost.
- A custom grid-reconstruction algorithm, not just raw OCR output. Raw OCR gives you a bag of text boxes with coordinates — it doesn’t know what’s a “row” or a “column.” The real engineering work went into turning that bag of boxes into a table: clustering text into rows by vertical position, then voting across all rows to find genuine column boundaries (rather than naively merging box edges, which collapses dense financial tables into a single column — an early bug we specifically tested for and fixed). This is the difference between “OCR that reads text” and “OCR that understands tables.”
- Tunable parameters exposed as sliders (row tolerance, column gap, confidence threshold) — because no OCR pipeline is perfect on every screenshot, and giving employees a couple of intuitive dials beats sending every edge case back to engineering.
The rationale throughout was: keep it simple, keep it local, keep it fast to run and cheap to maintain. A single-file tool with no server and no cloud OCR bill is easier for one person to own and for anyone else to pick up later.
Why this matters
This isn’t a flashy feature — it’s the unglamorous, high-frequency kind of work that quietly eats hours across a team every week. The value isn’t in the AI doing something impossible; it’s in AI-assisted development making it cheap enough to build a tool that solves a small, specific, recurring pain point that would never have justified a full engineering project on its own. That’s the real productivity unlock: not one big automation, but the ability to knock out dozens of small ones, each returning time to people who’d rather be analyzing data than reformatting it.